05:42
infozzz
| Solar | 97 W | Today: 0 kWh (£0.01) |  |
| Electricity | 321 W | Today: 2.5 kWh (£0.56) | |
| Gas | 0 W | Today: 0 kWh or 0 M3 (£0) |  |
| Geography | |||
| Location | North Manchester UK | ||
| Position | Roof mounted panels facing South East, roof angle 35° negligible shading | ||
| Mains electricity supply | UK single phase 240 Volt 100 Amp 50 Hz | ||
| Installed system details | |||
| Installation date: 25th July 2015 | 15 x Solarworld Sunmodule plus SW265 265 Watt solar panels | 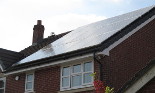 | |
| 1 x Ginlong (Solis) Inverter 3.6 kW 2nd Generation | |||
| 1 x Ginlong (Solis) WiFi 'stick' | |||
| 1 x Solar iBoost immersion heater controller | |||
| 1 x Landis+Gyr Generation meter | |||
| Roof hardware, cables, switches, installation etc | Total outlay: £5,600.00 | ||
| Solar feed in tariff (FIT) and fuel costs | |||
| Solar feed in (set from Jul 2015 for 20 yrs) | Currently 20.35 pence/kWh and 50% of 7.64 pence/kWh Total 24.17 pence/kWh | ||
| Electricity cost (supplier Octopus Energy) | Currently 21.96 pence/kWh and standing charge of 49.94 pence/day | ||
| Gas cost (supplier Octopus Energy) | Currently 5.46 pence/kWh (61.88 pence/M3) and standing charge of 31.38 pence/day (Calculation: M3=kWh*11.33426) | ||
| Savings so far, calculated from live data | |||
| Solar feed in | £6,849.38 (36,735 kWh) | Cash earned from solar generation | |
| Electricity saved | £4,254.36 (21,553 kWh) | All power up to 500W for duration of generation period is saved, and the difference between average daily consumption of 13kWh and the actual daily consumption | |
| Gas saved | £443.51 (7,985 kWh) | Power above 500W available to heat water max 4.5 kWh/day | |
| Total earned/saved | £11,547.25 | ||
| Financial status | |||
| Percentage of outlay recovered | 206.2% | Percentage of system cost of £5,600.00 recovered | |
| Time to taken recover outlay | 7 years and 7 months | Broke even March 2022 | |
| Profit made to date | £5,947.25 | ||
| Solar power league table - Best 20 days (Overall daily average 9.2 kWh ) | |||
| League position | Power generated | Most recent date | Number of days |
| 1 | 28 kWh | 03/06/2016 | 1 |
| 2 | 27 kWh | 29/04/2026 | 25 |
| 3 | 26 kWh | 24/05/2026 | 33 |
| 4 | 25 kWh | 24/04/2026 | 49 |
| 5 | 24 kWh | 30/05/2026 | 56 |
| 6 | 23 kWh | 20/06/2026 | 66 |
| 7 | 22 kWh | 10/05/2026 | 73 |
| 8 | 21 kWh | 23/06/2026 | 55 |
| 9 | 20 kWh | 15/06/2026 | 77 |
| 10 | 19 kWh | 22/06/2026 | 95 |
| 11 | 18 kWh | 25/09/2025 | 101 |
| 12 | 17 kWh | 14/06/2026 | 98 |
| 13 | 16 kWh | 08/06/2026 | 110 |
| 14 | 15 kWh | 10/06/2026 | 110 |
| 15 | 14 kWh | 31/05/2026 | 122 |
| 16 | 13 kWh | 05/06/2026 | 141 |
| 17 | 12 kWh | 19/06/2026 | 145 |
| 18 | 11 kWh | 18/06/2026 | 178 |
| 19 | 10 kWh | 04/06/2026 | 177 |
| 20 | 9 kWh | 06/06/2026 | 171 |
| Live system monitoring | |||
| 1. Reading the meters I have fitted home made pulse counters to my solar generation meter and to the mains supply meter. These sensors stick on the outside of the meters and monitor the LED’s that flash 1000 times per kWh. Solar information is also collected from the inverter via Wi-Fi. The gas meter is monitored by two magnetic sensors that track the rotation of a small magnet inside the meter. The two sensors are set at slightly different positions to accurately sense the movement of what can be a very slow moving magnet. Each rotation represents 1 cubic Litre of gas. | |||
| 2. Counting the pulses The three sensors connect to a Raspberry Pi which counts the pulses and times the duration between them to give the actual wattage being used at any time. Additionally the inverter is fitted with a Wi-Fi attachment which sends the status of the inverter with a lot of additional information E.g. it’s internal temperature, DC voltages and current, mains frequency etc. This is also received by the Raspberry Pi then decoded and stored. This is all achieved using some home written Python programs. | |||
| 3. Using the data The Raspberry Pi has a fully functioning web server running on it, so from another device on the local network, simple consumption and daily usage can be viewed on a constantly updated web page which is written using PHP. This is similar to the smart meter devices available to you from your energy supplier. | |||
| 4. Crunching the numbers The raspberry Pi has only limited storage and the SD memory cards used can fail over time. The next stage is to pull the information from the Pi using FTP at regular intervals to another computer on my network. This then stores the information into a MySQL database. The live data is then used to create the graphs you can see here. Again using PHP to read and manipulate the data. Additional cost information is also stored to allow calculations into real monitory values. Crunching the data across gas electricity and solar energy can produce interesting results with accurately estimated savings and usage which can be used to make further savings on fuel costs. | |||